
Social media analytics reveals what your audience actually wants, not what you assume they want. Most brands ignore the data sitting in their platforms, missing obvious opportunities to boost customer engagement.
At Innovative Events, we’ve seen firsthand how digital marketing customer engagement improves dramatically when teams shift from guessing to measuring. This guide shows you exactly which metrics matter and how to act on them.
What Metrics Actually Matter for Your Business
Social media analytics measures three things: what content performs, who engages with it, and when they engage. Most brands track vanity metrics like follower counts, which tell you almost nothing about business impact. Engagement rate matters far more than follower size, yet 67% of marketers still prioritize follower growth over meaningful interactions. The metrics that drive results are click-through rates, conversion rates, share of voice, and audience sentiment.
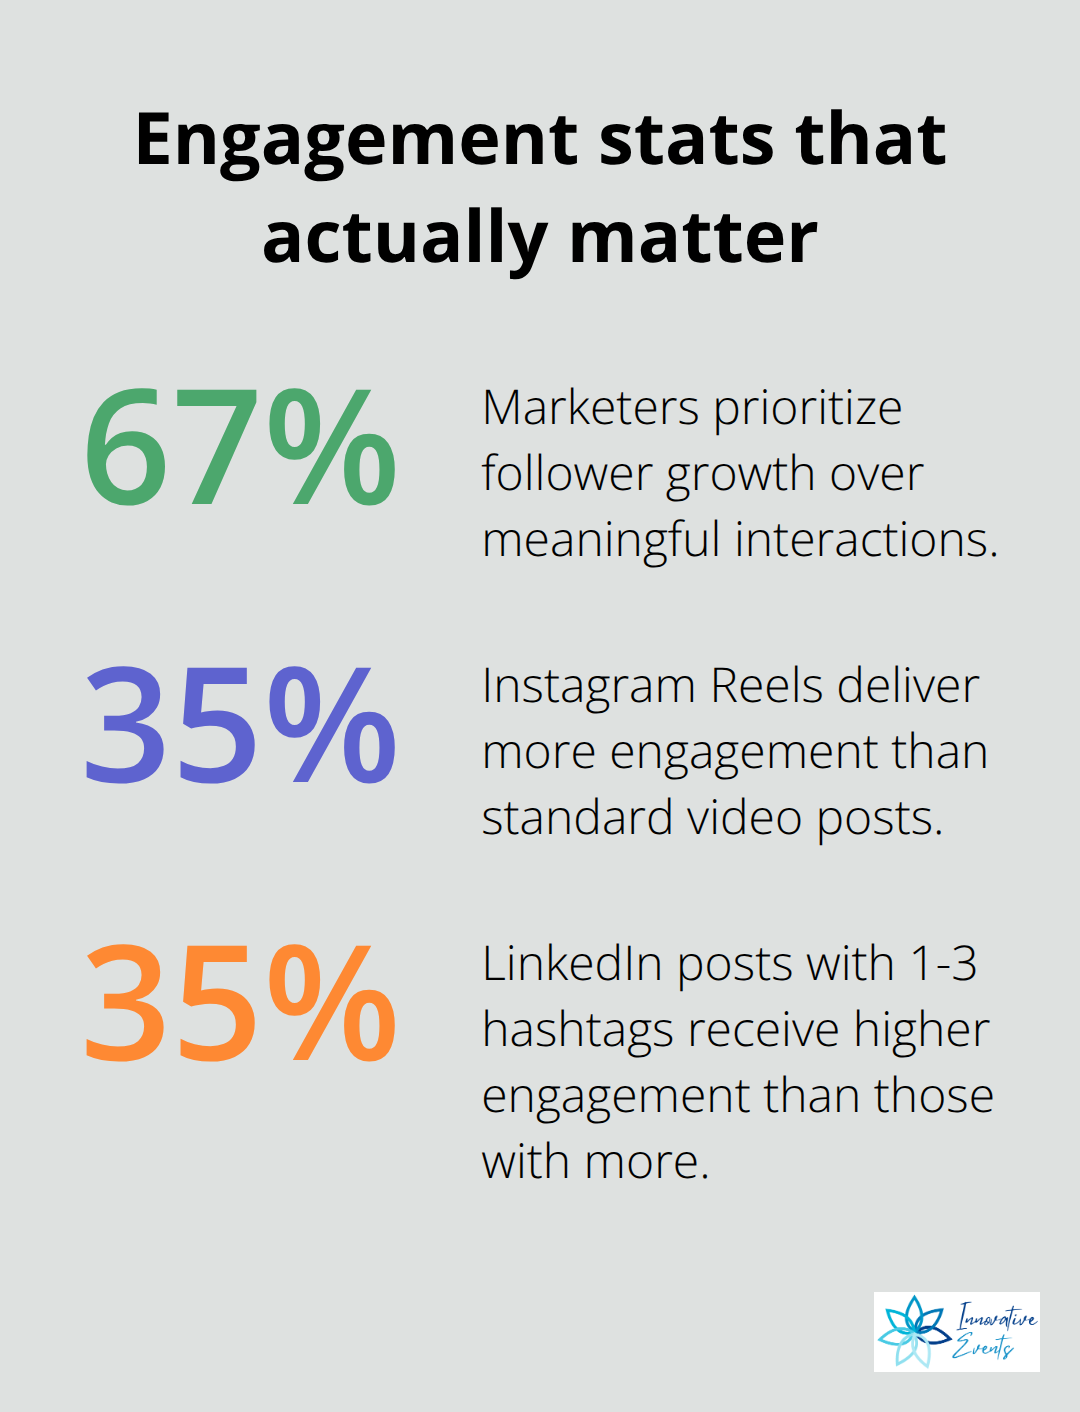
Instagram Reels deliver 35% more engagement than standard video posts, while LinkedIn data reveals that posts with 1-3 hashtags receive 35% higher engagement than those with more. Focus on metrics that connect to revenue and customer relationships, not metrics that look impressive in a status report. If a post gets 10,000 impressions but zero conversions, that post failed your business regardless of how the numbers appear. Track what actually happens after someone sees your content: do they visit your website, sign up for an event, or contact your team?
Connecting Analytics to Strategic Decisions
Your strategy should emerge from data patterns, not from what competitors are doing or what industry trends suggest. Facebook’s research shows that posts with specific calls-to-action generate 23% more conversions than posts without them, yet many brands still post without clear conversion intent. Start by identifying which content types drive your specific business outcomes. If you run events, track which social posts generate the most registrations. If you sell products, measure which content drives the most product page visits. HubSpot’s data indicates that brands tracking conversion metrics see a 20% improvement in campaign performance within the first quarter. The shift from guessing to measuring changes everything because you stop defending content you like and start defending content that works.
Setting Benchmarks and Evolving Your Approach
Set benchmarks for your industry using platform analytics, then beat those benchmarks consistently. Your strategy becomes a living document that evolves based on what the data reveals each week. This foundation of real metrics positions you to identify which audience segments respond most strongly to your message, information that transforms how you create and distribute content moving forward.
Turn Data Into Audience Segments That Actually Drive Sales
Analyze Your Audience Composition for Actionable Insights
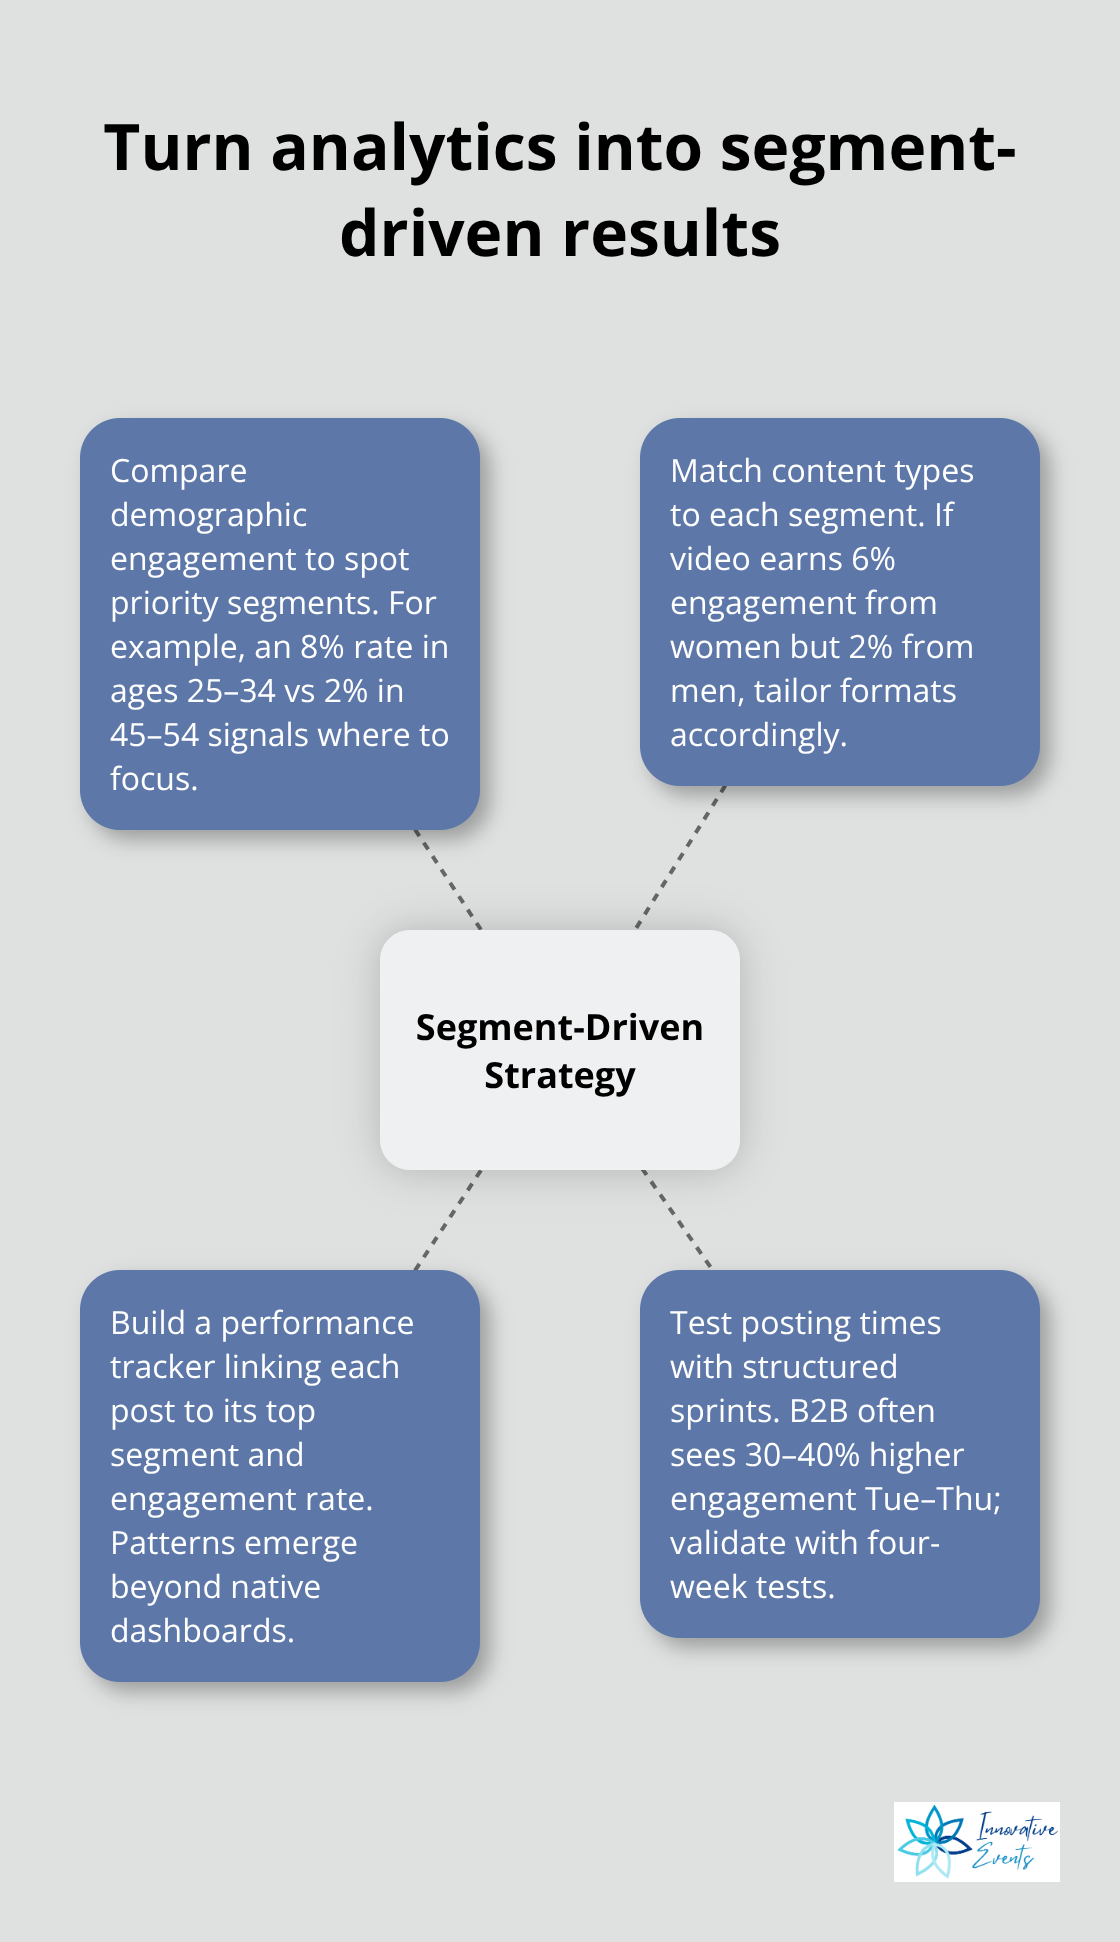
Your analytics platform shows which posts performed best, but it doesn’t automatically tell you why certain audience segments engaged while others ignored your content. Most brands stop at surface-level metrics and never examine the audience composition behind engagement metrics. Instagram Insights and Facebook Analytics break down your audience by age, location, gender, and interests, yet most marketers treat this data as background information rather than actionable intelligence. Start by comparing engagement rates across these demographic segments. If your 25-34 age group engages at 8% while your 45-54 group engages at 2%, your content strategy should shift dramatically toward the preferences of that younger segment.
Match Content Types to Specific Audience Segments
Identify which content types each segment actually responds to by filtering your top-performing posts by audience demographics. If video content generates 6% engagement from women but only 2% from men, create more video content aimed at women and test different formats for men. LinkedIn’s research shows that industry-specific data generates more engagement from decision-makers than motivational content, meaning your C-suite audience requires fundamentally different material than your general audience. This segmentation work takes two hours per week but eliminates months of wasted content creation on messaging nobody in your audience cares about.
Build a Performance Tracking System
Content performance data reveals what resonates, but only if you connect each piece of content to the specific audience segment that engaged with it. Create a simple spreadsheet tracking your top 20 posts with columns for content type, posting time, audience segment with the highest engagement, and engagement rate for that segment. This reveals patterns that your platform analytics hide. If your 35-44 demographic engages most with educational content posted on Tuesdays at 10 am, stop posting entertainment content to that group on Fridays.
Test Posting Times Methodically
Test posting times methodically because timing differences create dramatic engagement swings. HubSpot data indicates that B2B content posted Tuesday through Thursday generates 30-40% higher engagement than weekend posts, while B2C brands see stronger Saturday performance. Your specific audience may differ, so run four-week tests on different posting schedules and measure engagement rates by time slot. The brands winning on social media right now treat content creation as a scientific process, not an art project. They know their engaged segments, they know what content those segments want, and they know exactly when to deliver it. That combination transforms social media from a guessing game into a predictable revenue channel, positioning you to move forward with confidence into the next phase of optimization.
Practical Tools and Platforms for Social Media Analytics
Native Platform Analytics: The Foundation
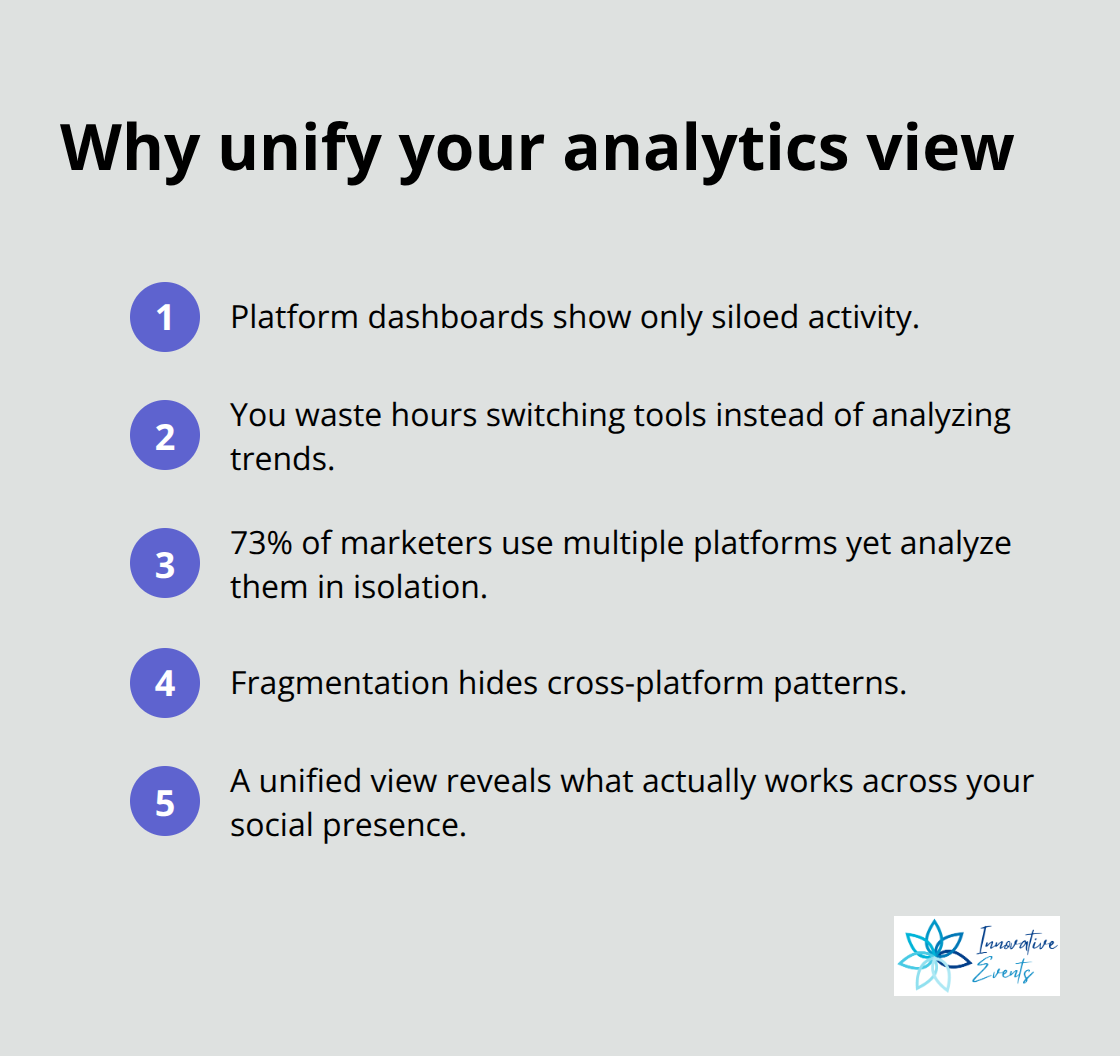
Native platform analytics like Facebook Insights and Instagram Analytics cost nothing and sit right inside your accounts, making them the logical starting point. Facebook Insights tracks engagement metrics for your Facebook page, Instagram Insights reveals what resonates on Instagram, and LinkedIn Analytics monitors professional content performance. The problem emerges immediately: each platform shows you only what happens within its own walls. You cannot see which audience segments follow you across multiple platforms or which content types drive results across your entire social presence. Most brands waste hours jumping between platform dashboards instead of building a unified view of their social performance. According to HubSpot research, 73% of marketers use multiple social platforms, yet they analyze each one in isolation. This fragmentation means you miss patterns that only appear when you look at your complete social strategy.
Third-Party Tools That Connect Your Data
Third-party analytics tools like Sprout Social, Hootsuite Analytics, and Buffer Analytics solve this exact problem by pulling data from all your platforms into one dashboard. Sprout Social costs between $249 and $499 monthly, depending on features, while Buffer Analytics ranges from $15 to $99 monthly. These tools aggregate your metrics across Facebook, Instagram, LinkedIn, Twitter, and TikTok so you can identify which content types drive engagement across your entire social strategy, not just on individual platforms. More importantly, they show you audience overlap, which followers engage on multiple platforms, and what content captures their attention everywhere. This cross-platform visibility eliminates wasted effort on content that performs nowhere. Advanced tools like Brandwatch and Talkwalker cost significantly more ($1,000+ monthly) but monitor competitor activity, track brand mentions across the internet, and analyze audience sentiment at scale. Most brands starting out should begin with native platform analytics for baseline metrics, then add a mid-tier tool like Sprout Social or Hootsuite once they manage three or more social accounts actively.
Connecting Analytics to Business Outcomes
Integration is where most brands fail because they collect data but never connect it to actual business outcomes. Google Analytics should connect to your social media platforms through UTM parameters so you can track which social posts actually drive website traffic and conversions. Set up UTM tracking by adding parameters to your social links: utm_source=facebook, utm_medium=social, utm_campaign=Q1-2026-launch. Without this, you see engagement metrics but not revenue impact. HubSpot’s CRM integrates with social platforms to show you which social followers actually became customers, revealing which audience segments and content types generate real business value. Zapier and Make automate data flow between your analytics tools, CRM, and email platform so metrics update automatically without manual spreadsheet work. Connecting analytics to your event registration systems matters especially if you run events-track, which social posts generate the most event signups, which audience segments register, and what content drives attendees who actually show up. This integration transforms analytics from vanity metrics into a predictive system that shows which social efforts move business forward. Most brands collect 80% of the data they need but fail to connect it, leaving money on the table.
Final Thoughts
Analytics transform social media strategy from opinion-based guessing into measurable, repeatable systems that drive revenue. When you stop assuming what your audience wants and start measuring what they actually engage with, everything changes. The brands winning right now treat digital marketing customer engagement as a data science problem, not a creative one, and they know their audience segments, understand which content types convert, and post at times when their specific followers pay attention.
Start small this week by reviewing your native platform analytics for 30 minutes-identify which posts generated the most engagement and which audience segments responded. Track one metric that connects directly to your business outcome, whether that’s event registrations, product sales, or contact form submissions, for four weeks to establish your baseline performance. Then test one change based on what the data revealed: adjust your posting time, shift your content type, or refocus on your most engaged demographic, and measure the results for another four weeks.
The long-term benefit of data-driven engagement is predictability (most brands treat social media as a lottery where some posts succeed and others fail randomly). When you connect analytics to business outcomes, social media becomes a channel you can forecast and optimize, transforming it from a cost center into a revenue channel. If you’re managing multiple social platforms and struggling to see clear results, Innovative Events specializes in social media and engagement strategies that connect your content directly to business outcomes through digital marketing, customer engagemen,t and social media planning.