
Most content marketers track dozens of metrics but struggle to turn that data into actionable insights. A well-structured content marketing report cuts through the noise and shows what actually moves the needle for your business.
At Innovative Events, we’ve seen firsthand how the right reporting approach transforms raw data into strategy. This guide walks you through building reports that stakeholders actually read and act on.
What Actually Matters in Your Report
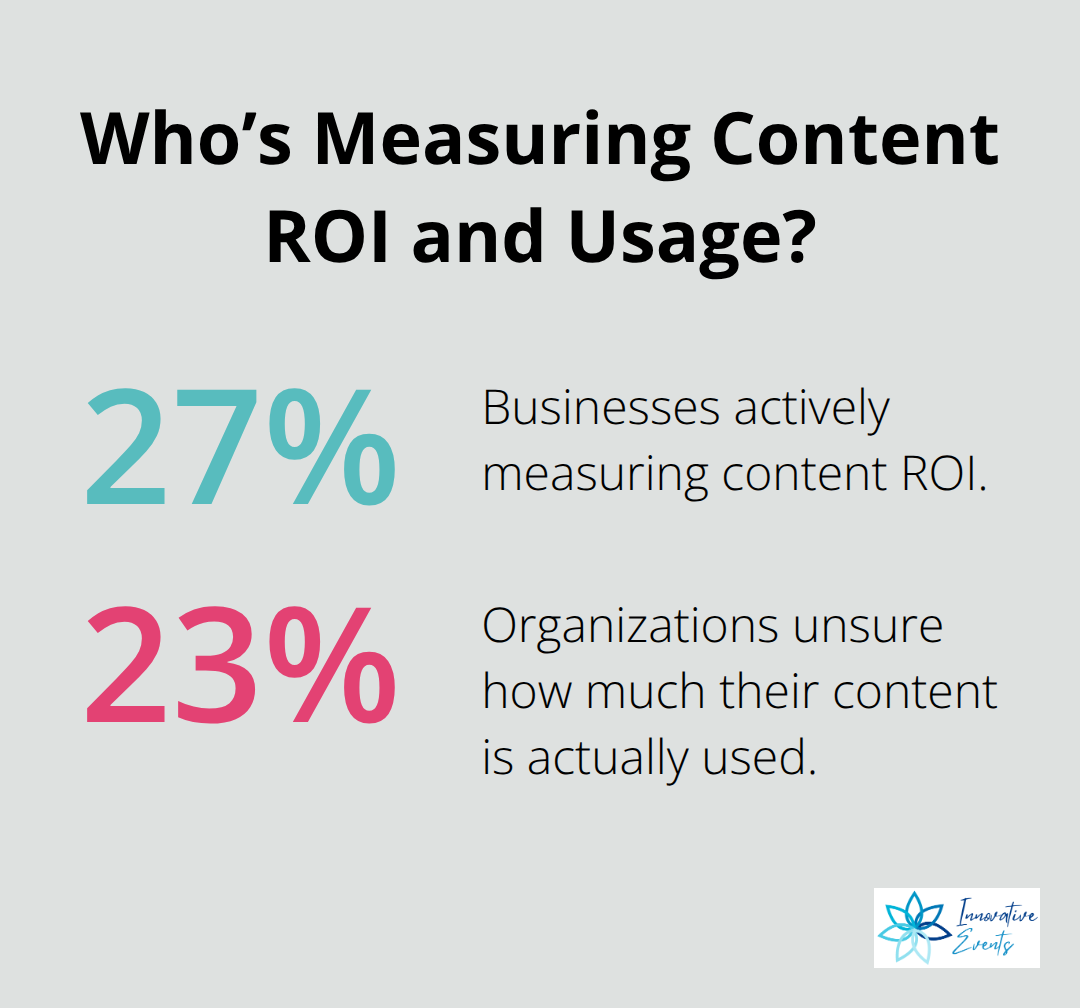
The Content Marketing Institute found that 27% of businesses actively measure content ROI, while 23% remain unsure how much their content is actually used. This gap exists because most reports include too many metrics and not enough meaning. You need to stop tracking vanity metrics like page views and impressions and start measuring what drives revenue. Traffic without conversions is noise.
Define Metrics That Connect to Business Outcomes
The first step is identifying which metrics directly connect to business outcomes. If your goal is lead generation, track form submissions and cost per lead. If it’s customer retention, monitor repeat visits and email engagement rates. If it’s brand awareness, measure branded search volume and share of voice. Each metric should answer a specific question: Does this tell us if we’re winning or losing?
According to the CMI report, businesses that align content analytics with core business priorities using cross-functional OKRs see measurable improvement in adoption, leads, and retention. This means your CFO and sales leader should sit in on metric selection, not just your marketing team. When finance and sales help choose metrics, everyone commits to the same definition of success.
Build a Balanced KPI Set
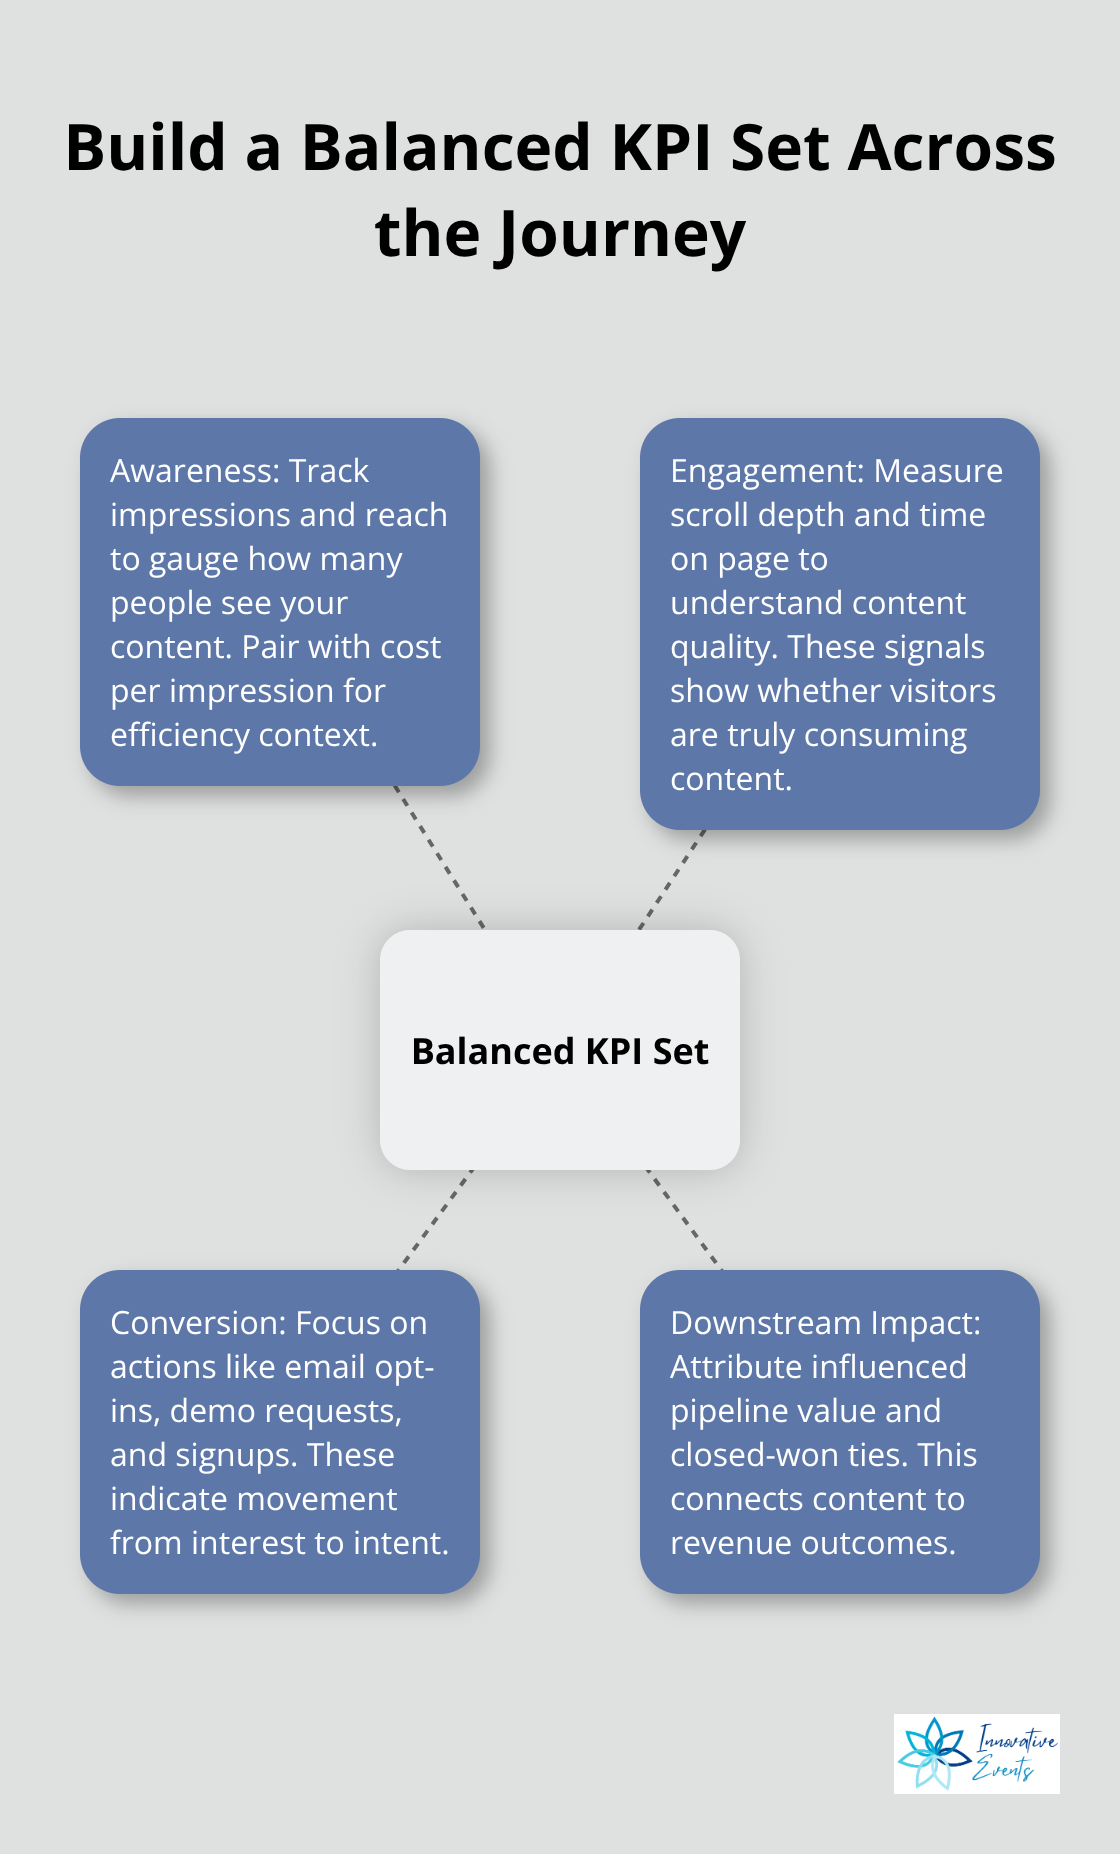
Most reports fail because they present data without context. Showing that organic traffic increased 15% means nothing if conversion rate dropped 8%. You need a balanced KPI set that captures both primary conversions (demo requests, purchases, signups) and secondary signals (pricing page visits, downloads, content downloads).
The CMI data shows that pace-setters-marketers at established, advanced, or leading stages combine quantitative metrics with qualitative insights like session replays and user interviews to understand not just what happened, but why. A practical approach is to build a single dashboard that consolidates your CMS, analytics platform, and CRM data in one view. This eliminates the need to switch between tools and makes patterns obvious.
Track top-of-funnel indicators like impressions and reach, engagement signals like scroll depth and time on page, conversion actions like email opt-ins, and downstream impact like pipeline value influenced by content. Most importantly, segment these metrics by content topic, format, and audience segment to reveal which types of content actually work for your business.
Make Your Data Visible at a Glance
Reports that require five pages of explanation fail before stakeholders finish reading. Data visualization cuts through complexity. Instead of listing ten metrics in a table, create a simple dashboard showing your three most important KPIs with month-over-month change. Use red for declining metrics and green for improving ones. This takes 10 seconds to understand instead of 10 minutes.
When you include visualizations, stakeholders spend more time understanding insights and less time decoding numbers. The CMI research shows that organizations using real-time alerts and regular reporting with clear visual formats scale successful content patterns faster than those using static monthly reports. Include a comparison view that shows your performance against industry benchmarks so stakeholders understand whether a 5% improvement is meaningful or if competitors are moving twice as fast.
The next step is structuring your report so these metrics tell a coherent story that drives action.
How to Structure Your Content Marketing Report
Start with an Executive Summary That Demands Action
Your report structure determines whether stakeholders act on insights or file it away unread. Start with an executive summary that answers one question: what changed this period and why should anyone care? This summary should fit on a single page and contain three elements. First, state your primary business objective and whether you’re tracking toward it. Second, highlight your top three KPI movements with context, not just that organic traffic grew 12%, but that this traffic converted at 3.2%, up from 2.8% last month, generating 24 additional qualified leads. Third, call out one critical finding that demands immediate action. If your content’s average time on page dropped 40% across your top-performing topics, flag it. If email engagement rates on nurture content hit a three-year low, surface it immediately.
The CMI research shows that content strategy improvement is driven by strategy refinement, with 74% of marketers pointing to this as the biggest driver. Your summary creates the conditions for that refinement by forcing clarity about what matters most.
Organize Performance by Customer Journey Stage
The detailed breakdown should organize performance by channel, but not in the way most reports do. Avoid listing every metric for email, social, organic search, and paid search separately. Instead, organize by the customer journey stage, and each channel dominates. Your awareness-stage channels might include organic search and social media-show impressions, reach, and traffic volume alongside cost per impression. Your consideration-stage channels might include email and content downloads, track engagement rate, click-through rate, and lead quality. Your decision-stage channels might include retargeting ads and case study downloads-measure conversion rate, cost per conversion, and pipeline value.
This structure forces alignment between channel performance and business outcomes. Within each section, include a month-over-month comparison and a benchmark against your targets or industry performance if available. Then add one sentence explaining the why behind significant moves. Did organic traffic decline because you published fewer posts, or did rankings drop? Did email open rates fall because you changed subject lines, or did list quality degrade?
Connect Recommendations to Business Impact
Recommendations flow naturally from this diagnosis. If your consideration-stage content underperforms, recommend specific topics or formats to test. If the cost per conversion on paid channels exceeded the budget, recommend pausing underperforming audiences or adjusting the bid strategy. Pace-setters measure sales timelines alongside content performance, revealing which content actually shortened deals. Include this in your recommendations-not just what to do, but what business impact you expect.
If you recommend increasing case study production, estimate the pipeline value that could result. If you recommend refreshing evergreen content, project the recovery based on historical performance data. Action items should assign ownership and deadlines. Vague recommendations like improve blog performance fail because no one owns the outcome. Clear recommendations like test three new buyer-focused headlines on your top underperforming post by Friday, measure click-through rate, and report results by next Tuesday create accountability and move your content strategy forward.
Tools and Platforms for Reporting
The right tool stack eliminates hours of manual work and prevents the reporting mistakes that plague most teams. Most marketers waste time exporting data from Google Analytics, copying numbers into spreadsheets, and manually building visualizations each month. This approach guarantees errors and delays action. Your reporting software should consolidate data from your CMS, web analytics platform, and CRM into a single dashboard that updates automatically.
Analytics Platforms Form Your Foundation
Google Analytics 4 remains the foundation for most teams, but GA4 alone cannot answer the question your CFO actually cares about: how much revenue did this content influence? You need a layer on top that connects web behavior to pipeline and closed deals. Tools like Mixpanel and Amplitude track user journeys across multiple touchpoints, letting you see which content assets appear in winning customer paths versus paths that stall. For teams running paid campaigns alongside organic content, connecting your ads platform data matters equally. Most reporting failures happen because paid and organic metrics live in separate worlds. Supermetrics or Improvado bridge this gap by pulling data from Google Ads, Facebook Ads, LinkedIn, and your analytics platform into one reporting interface, eliminating the spreadsheet chaos that delays insights by weeks.
Automation Replaces Manual Reporting Work
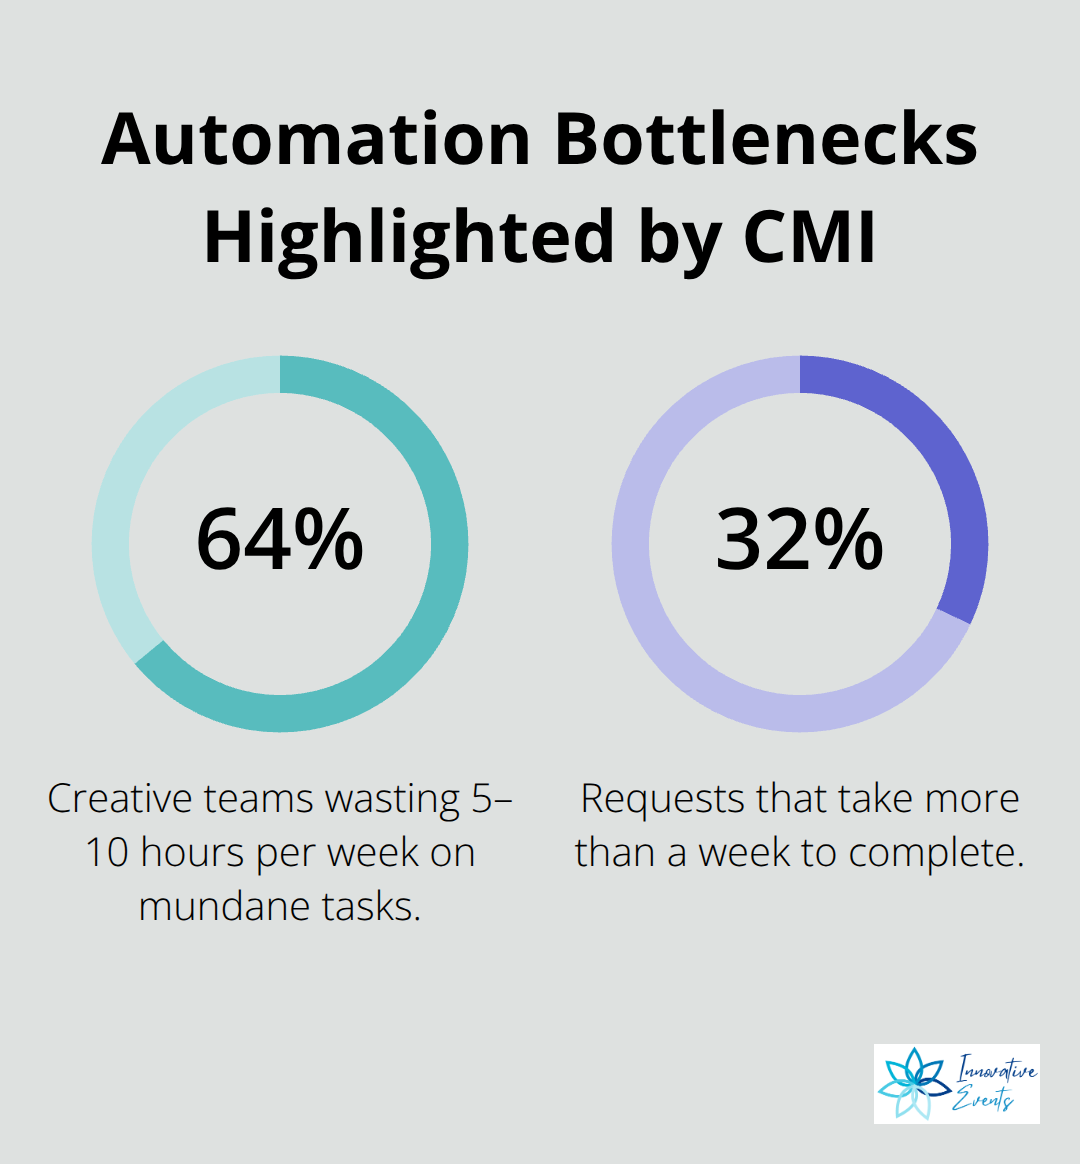
The CMI research shows that 64% of creative teams waste 5 to 10 hours per week on mundane tasks, and 32% of requests take more than a week to complete. Automated reporting addresses reporting errors and delays directly. Platforms like Tableau, Data Studio, and Looker build dashboards that refresh daily without human intervention, meaning your stakeholders always see current data instead of outdated month-end reports. Looker specifically excels at connecting your CRM data to content metrics, showing exactly which topics and formats influence pipeline progression.
Once you establish the dashboard structure, the software handles all data pulling and visualization updates. Set alerts that notify you instantly when key metrics move outside expected ranges-if your email conversion rate drops 25% or your top-performing topic stops ranking, you know immediately, instead of discovering it during report writing. Automation also eliminates the single biggest source of reporting errors: manual data entry and copy-paste mistakes. Organizations using real-time alerts and regular reporting with clear visual formats scale successful content patterns significantly faster than those relying on static monthly reports.
Define Ownership and Align Tools to Stakeholder Needs
Most teams select tools first and build process second, which guarantees underutilization. Instead, start by defining exactly who needs what data and when. Your sales leader needs conversion metrics by content topic updated weekly. Your CFO needs content ROI and cost per acquisition updated monthly. Your creative team needs performance data by format and channel updated daily to guide what they create next. Once you map these needs, select tools that serve those specific audiences. Segment your reporting so each stakeholder receives only the metrics relevant to their decisions. A dashboard showing your entire marketing team’s 47 metrics confuses everyone and drives no action. Three focused dashboards for sales, finance, and content teams work far better. Ownership matters equally. Assign one person to own the reporting infrastructure and maintain data quality. This person ensures that UTM parameters are applied consistently, that tracking gaps get fixed quickly, and that dashboard definitions stay aligned with business reality. Without ownership, your reporting tools become expensive storage for unreliable data that stakeholders learn to ignore.
Final Thoughts
A strong content marketing report shows what actually happened, explains why it matters, and tells stakeholders exactly what to do next. Without this clarity, your data becomes noise instead of fuel for better decisions. The reports that drive action combine clear metrics tied to business outcomes, visual dashboards that communicate instantly, and recommendations backed by specific business impact.
Implementing these practices starts small. Pick your three most important business outcomes this quarter, identify the metrics that prove you’re winning or losing against each outcome, and build a single dashboard showing those metrics with month-over-month context. Share it with stakeholders weekly instead of monthly, and this alone transforms how your organization responds to content performance. Each step compounds as you add secondary signals that explain why primary metrics moved and connect your CRM data to content performance so you see which topics influence the pipeline.
The teams winning at content marketing right now are not the ones with the biggest budgets or most tools-they are the ones who treat their content marketing report as a strategic document that drives decisions, not a compliance checkbox. We at Innovative Events help brands transform their content strategy through better measurement and reporting, and we’d welcome the chance to explore how events and content work together to drive your business outcomes.