
Most content marketers still rely on guesswork instead of data. At Innovative Events, we’ve seen firsthand how data-driven content marketing transforms results-companies that use analytics to guide their strategy see 3x higher engagement rates than those flying blind.
The difference isn’t complicated. When you know what your audience actually searches for, what formats they prefer, and which topics convert, you stop wasting time on content that doesn’t work.
Who Is Your Audience Really?
Measure What Matters First
Start with what you can measure directly: demographics and behavior. Google Analytics shows you age ranges, locations, and devices your visitors use. Your CRM reveals job titles, company sizes, and purchase history. Combine these signals and you stop guessing about who consumes your content.
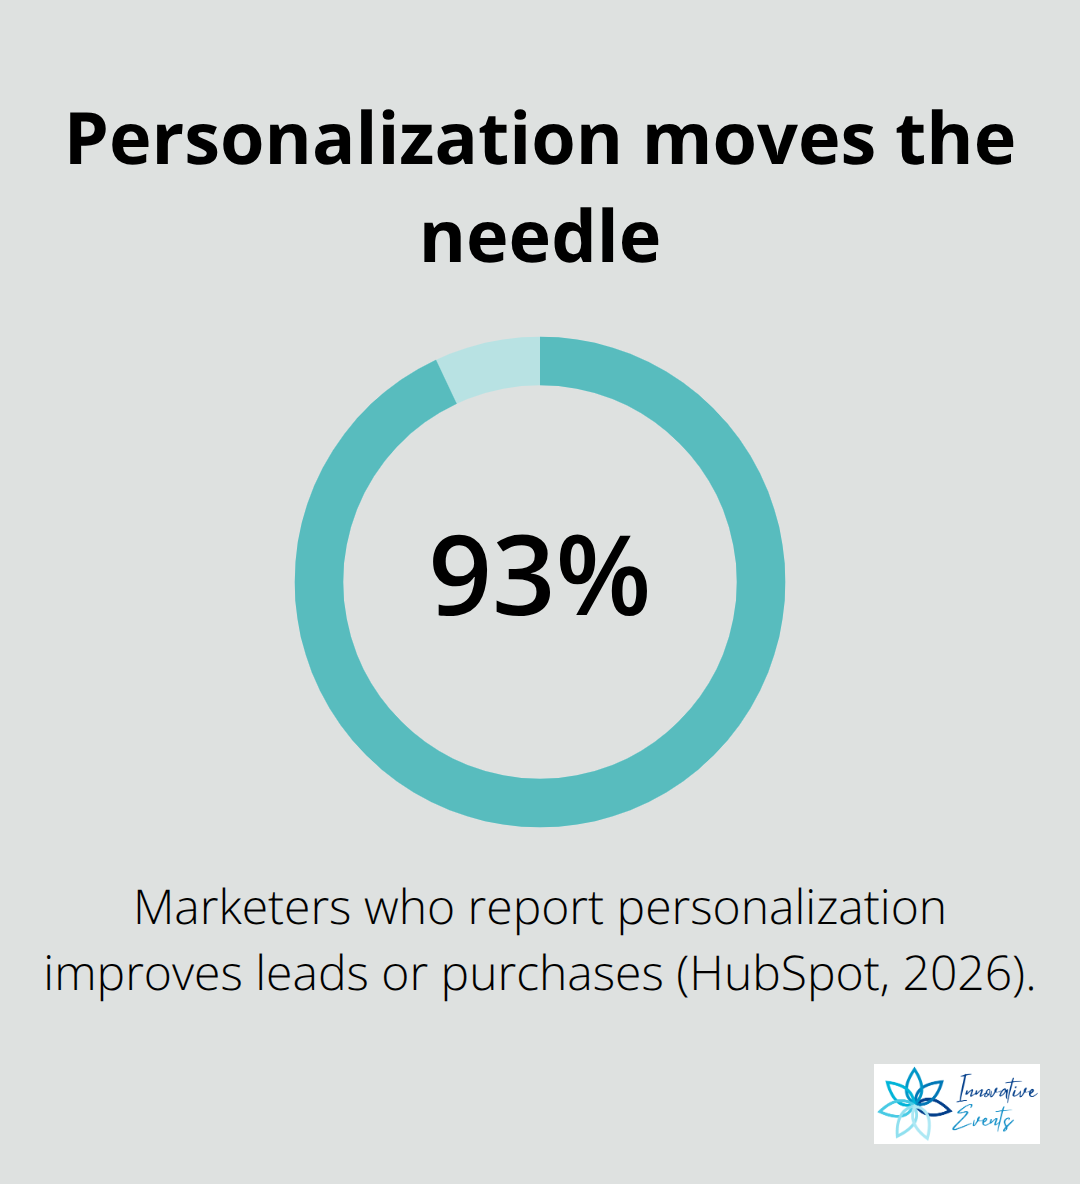
According to HubSpot’s 2026 State of Marketing Report, 93% of marketers report that personalization improves leads or purchases, yet most skip the foundational work of understanding their audience segments. This is where most fail.
You need to go beyond surface-level demographics and layer in behavioral data-what pages people visit, how long they stay, which content they share, and where they drop off. Tools like Google Analytics and your website heat mapping software show exactly where attention lives. If your audience spends three minutes on product comparison content but leaves your pricing page in seconds, that tells you something concrete about their readiness and concerns.
Firmographic Data Shapes Content Strategy
Firmographic data matters too. If you target mid-market companies versus enterprises, their content needs diverge sharply. An enterprise buyer researching implementation timelines needs different content than a startup evaluating whether your solution fits their budget. This distinction determines which topics you prioritize and how you frame solutions.
Segment First, Create Second
Segmentation isn’t optional-it’s the foundation of relevance. HubSpot data shows segmented emails drive higher engagement than blasted campaigns. This same principle applies across all content. Divide your audience into meaningful groups based on job function, company size, industry, or buying stage.
A CFO reading your blog has different priorities than a marketing director, even if they work at the same company. You should build separate content strategies for each segment rather than creating one-size-fits-all pieces. Your analytics tools should show you which segments engage with specific topics. If IT decision-makers consume your security content at twice the rate of operations teams, allocate more resources to security-focused pieces for that segment.
Layer In Intent and Pain Points
Progressive profiling through forms and surveys adds layers to your understanding over time. Ask specific questions that reveal intent and pain points, not generic demographic questions. This data feeds back into your content planning and ensures each segment sees messages built for them. Once you understand who your audience truly is-their roles, behaviors, firmographics, and pain points-you’re ready to create content that actually resonates with what they search for and need. Start by creating detailed buyer personas to move beyond demographics and uncover your ideal customers’ real challenges.
Building Content Around What People Actually Search For
Start with search intent data, not hunches about what topics matter. Tools like SEMrush and Moz reveal exactly what your audience searches for and how many people search it each month. This matters because creating brilliant content on topics nobody searches for wastes your time. You need the intersection of three things: search volume high enough to justify effort, relevance to your audience segments, and alignment with your business goals. Open SEMrush, filter for your industry and target keywords, then look at search volume trends over the past year. If search interest declines, that topic loses priority no matter how interesting it sounds. According to HubSpot’s 2025 data, blog posts still rank among the top five highest-ROI content formats, but only when they target keywords people actually search for. This means your content calendar should stem from keyword research, not brainstorming sessions.
Match Content Format to Search Behavior
Different search queries demand different formats. Someone searching for how to implement a solution wants a step-by-step guide or video, not a 2,000-word article about industry trends. Someone in early research mode searching for comparison articles wants a side-by-side analysis. Your analytics reveal which formats your audience engages with most.
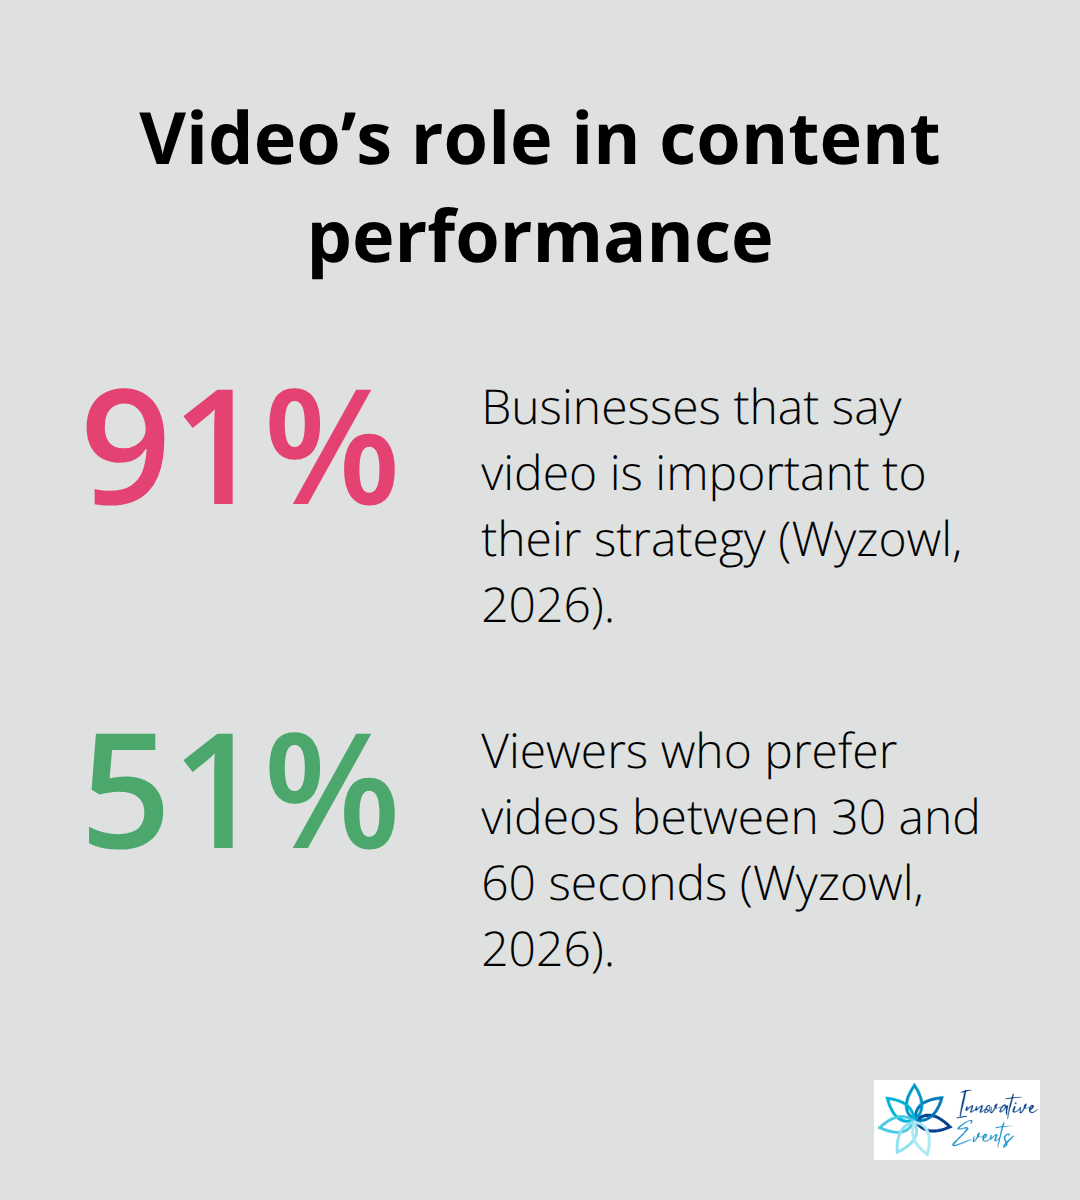
Video marketing deserves serious attention here: 91% of businesses say video is important to their strategy according to Wyzowl’s 2026 data, and 51% of viewers prefer videos between 30 and 60 seconds. This tells you that short-form video content aligned with specific search queries converts better than longer pieces. When you see search demand for implementation questions, create a 45-second video answering exactly that question. When demand exists for comparison content, build detailed comparison posts optimized for those keywords. Most teams produce content in their preferred format rather than the format their data shows performs best.
Use Performance Data to Know What Works Before You Publish
Your existing content reveals patterns about what resonates with each audience segment. Pull your top-performing content by engagement rate and conversion rate from Google Analytics and Google Search Console. Look at the topics, keywords, content length, and format of these winners. If your best-converting content averages 1,200 words and uses data-heavy sections with real numbers, that becomes your template going forward. If short-form video consistently drives more clicks than long-form written pieces, shift your production toward video. The average blog post length dropped to around 1,350 words in 2025 and continues declining, which suggests audiences prefer concise, focused content over comprehensive deep-dives. This doesn’t mean never write long content, but it means testing shorter pieces first and measuring performance before committing resources to lengthy formats. Track metrics that connect to revenue: not just page views, but conversion rates, time on page for high-intent keywords, and click-through rates from search results. A piece with lower traffic but a higher conversion rate often delivers more business value than high-traffic content that doesn’t convert.
Optimize for Keywords Your Audience Actually Uses
Keyword optimization goes beyond stuffing terms into your content. Your audience uses specific language when they search, and your content should match that language exactly. If your target audience searches “how to reduce implementation costs” rather than “cost optimization strategies,” write content that answers that specific question with that specific phrasing. Google Search Console shows you the exact queries that bring people to your site and which pages rank for those queries. Use this data to identify gaps where you rank for related keywords but not the high-intent ones. If you rank for “software comparison” but not “software comparison for small teams,” that’s a content opportunity. Optimize your meta descriptions and title tags to match search intent as well; these elements appear in search results and influence click-through rates. A compelling meta description that matches what searchers actually want can lift your CTR by 20% or more, even without ranking higher.
Align Content Depth with Buyer Journey Stage
Different stages of the buyer journey require different content approaches. Early-stage awareness content should answer broad questions and establish your expertise. Mid-stage consideration content should compare solutions and address specific concerns. Late-stage decision content should remove final objections and facilitate action. Your keyword research reveals which stage each search query represents. Someone searching “what is [solution type]” is in awareness. Someone searching “[your solution] vs [competitor]” is in consideration. Someone searching “how to implement [your solution]” is in a decision. Create content that matches each stage with the depth and focus that stage requires. This alignment ensures your content strategy covers the full journey rather than clustering around one stage where you might already have strength.
Now that you understand what your audience searches for and which formats and depths drive results, the next step involves measuring how your content actually performs against these expectations and adjusting your strategy based on real data. Boosting visibility naturally with proven strategies ensures your content reaches the right people at the right time.
Measuring What Actually Moves the Needle
Stop tracking vanity metrics. Page views, impressions, and time on page tell you almost nothing about whether your content works. Focus on metrics that connect directly to revenue: conversion rates, cost per lead, and return on ad spend. Google Analytics shows conversion rate by landing page and source, but you need to configure this properly. Set up conversion goals in Google Analytics that match your business outcomes-not just form submissions, but qualified leads or actual sales. Then segment these conversions by traffic source, content type, and audience segment to see which combinations drive real results. According to HubSpot’s 2026 State of Marketing Report, 77% of marketers rate lead quality as a high priority, yet most track quantity instead. A piece of content that brings 100 visitors but converts 15% of them into qualified leads delivers more value than content attracting 500 visitors at 2% conversion.
Identify Patterns in Your Best Performers
Track conversion rates separately for each content piece, then identify patterns. If your comparison content converts at 12% but your educational content converts at 3%, shift resources toward comparison-style pieces. Google Search Console reveals another critical metric: click-through rate from search results. A piece ranking in position 5 with 8% CTR outperforms a piece in position 2 with 2% CTR. This means your meta description and title tag matter more than you think. Test different headline approaches and track which ones searchers actually click. If your current title gets 2% CTR and a rewritten version gets 4% CTR, that’s a 100% improvement in traffic from the same ranking position.
Test One Variable at a Time
A/B testing different content approaches reveals what your specific audience prefers, not what marketers assume works. Test one variable at a time: headline style, content length, format, or visual approach. If you test five variables simultaneously, you cannot isolate which one drove the results. Wyzowl’s 2026 data shows 51% of viewers prefer videos between 30 and 60 seconds, but this applies to general audiences. Your audience might prefer 90-second videos or two-minute videos.
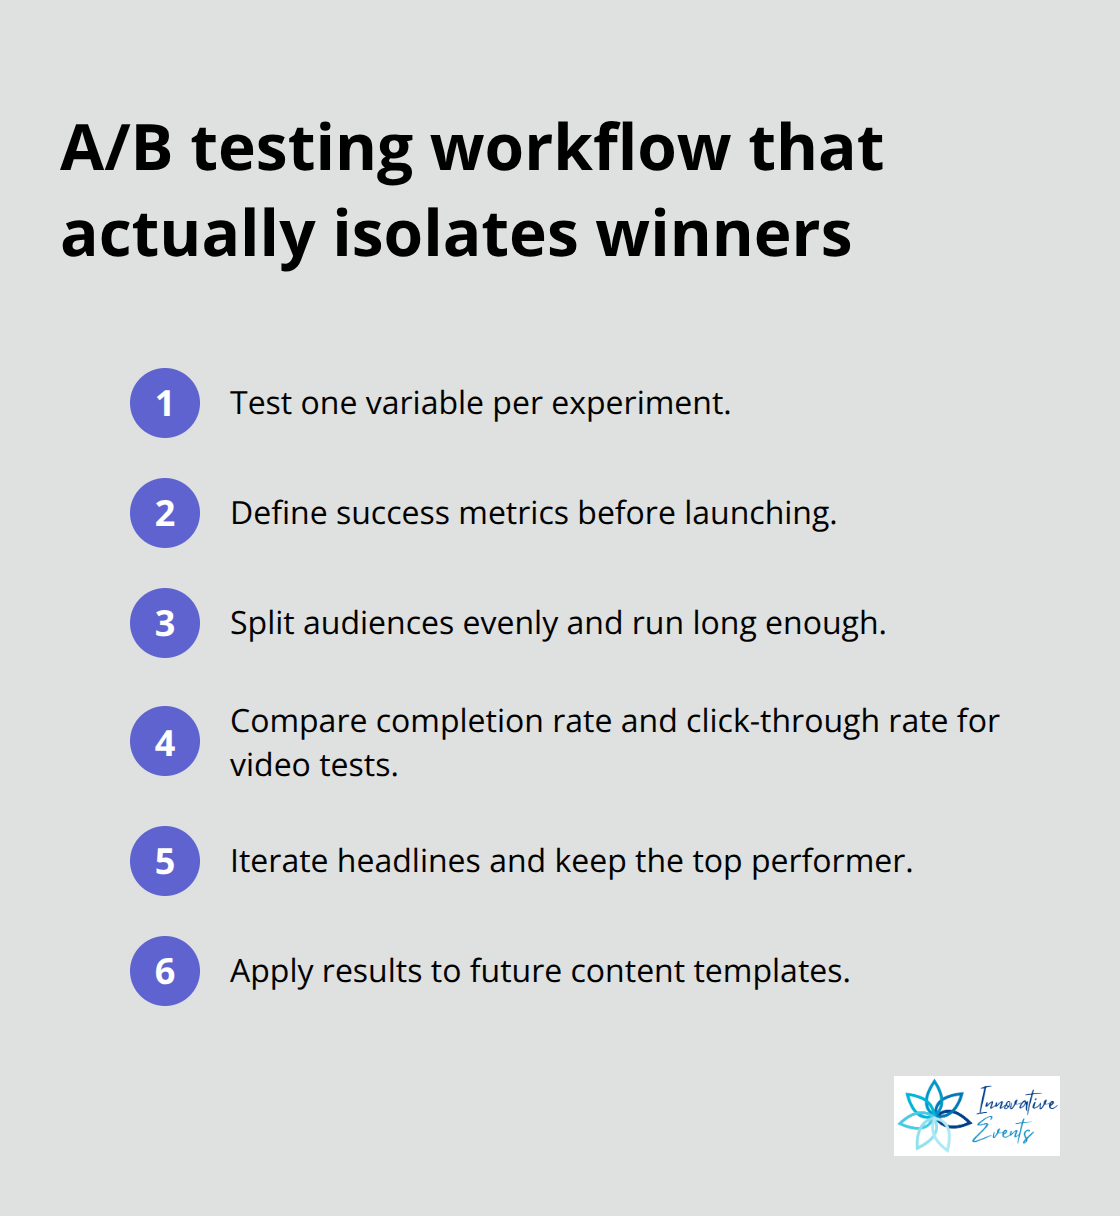
Test both lengths, measure completion rate and click-through rate, then build future videos at the length that performs better. Test headlines ruthlessly-your first headline rarely performs best. Write three different headlines for the same piece of content, publish them at different times to similar audience segments, then measure CTR and conversion rate for each. The winning headline becomes your template for future pieces. Try different content depths as well. Publish a 1,000-word version of a topic and a 2,500-word version to similar audiences, measure conversion rates, and let data decide. Short-form video consistently outperforms long-form video according to HubSpot’s 2026 report, with 49% ROI versus 29% for long-form, but this varies by topic and audience. Your data matters more than industry benchmarks.
Apply Multi-Touch Attribution
Attribution modeling matters because your audience rarely converts from a single piece of content. Someone might read your awareness blog post, then watch a comparison video, then download a case study before requesting a demo. Which touchpoint deserves credit? Multi-touch attribution gives fractional credit to each piece rather than crediting only the final click. This prevents you from overinvesting in late-stage content while starving early-stage awareness content. Most analytics platforms default to last-click attribution, which distorts your understanding of what actually works. Configure your analytics to use first-click, linear, or time-decay attribution instead (depending on your sales cycle length). This shift alone often reveals that early-stage content drives far more value than last-click metrics suggest.
Final Thoughts
Data-driven content marketing separates winners from everyone else. Companies that measure what works, test relentlessly, and shift resources toward high-performing tactics build sustainable competitive advantages while competitors waste budget on assumptions. The cycle repeats continuously: understand your audience through real data, research what they search for, create content matching their intent, measure performance against revenue-connected metrics, and apply multi-touch attribution to see the full picture.
Your implementation starts now. Audit your analytics setup and fix tracking gaps, define metrics that connect to revenue, segment your audience, and research what each segment searches for. Start testing different content approaches and measure results against conversion rates, cost per lead, and return on ad spend rather than vanity metrics. This shift alone transforms how you allocate resources and accelerate optimization.
We at Innovative Events help brands build content that drives measurable results through data-driven strategies. Whether you need help developing your content strategy or executing campaigns that convert, we’re here to guide you through implementation and help you capture the competitive advantage that data-driven content marketing delivers.